How Observe.AI Decodes Conversations to Identify Multi-Level Contact Reasons
What are Interaction drivers and why do they matter?
Customers or agents always make calls or initiate an interaction for a specific reason or objective – which we define as an interaction driver. Observe.AI is designed to extract one or multiple of these interaction drivers from conversations, which then becomes fundamental to forming meaningful groupings (or associations) within our L1/L2/L3 cluster hierarchy.
For instance, our system can "identify drivers where customer sentiment is negative for loan repayments. This is critical, because with large call volumes, underlying drivers provide customer service teams with the most effective framework for generating structured and meaningful insights.
Interaction drivers are most effectively organized through a multi-level hierarchical structure, typically focusing on Level-1 (L1) and Level-2 (L2) categories for optimal clarity. But, our methodology extends to help build any number of levels or sub-categories.
To illustrate how this hierarchy provides clarity, consider a common scenario in retail banking.
- L1: Broad Business Theme: This is the highest-level category, aligning with a major business function or customer journey.
Example: Loan & Mortgage Services - L2: Specific Topic or Process A more granular topic within the L1 theme that describes a specific process or area of inquiry.
Example: Repayment & Servicing - L3: Granular Intent The most detailed level, capturing the specific underlying reason for the customer’s interaction.
Example: Customer inquires about late payment
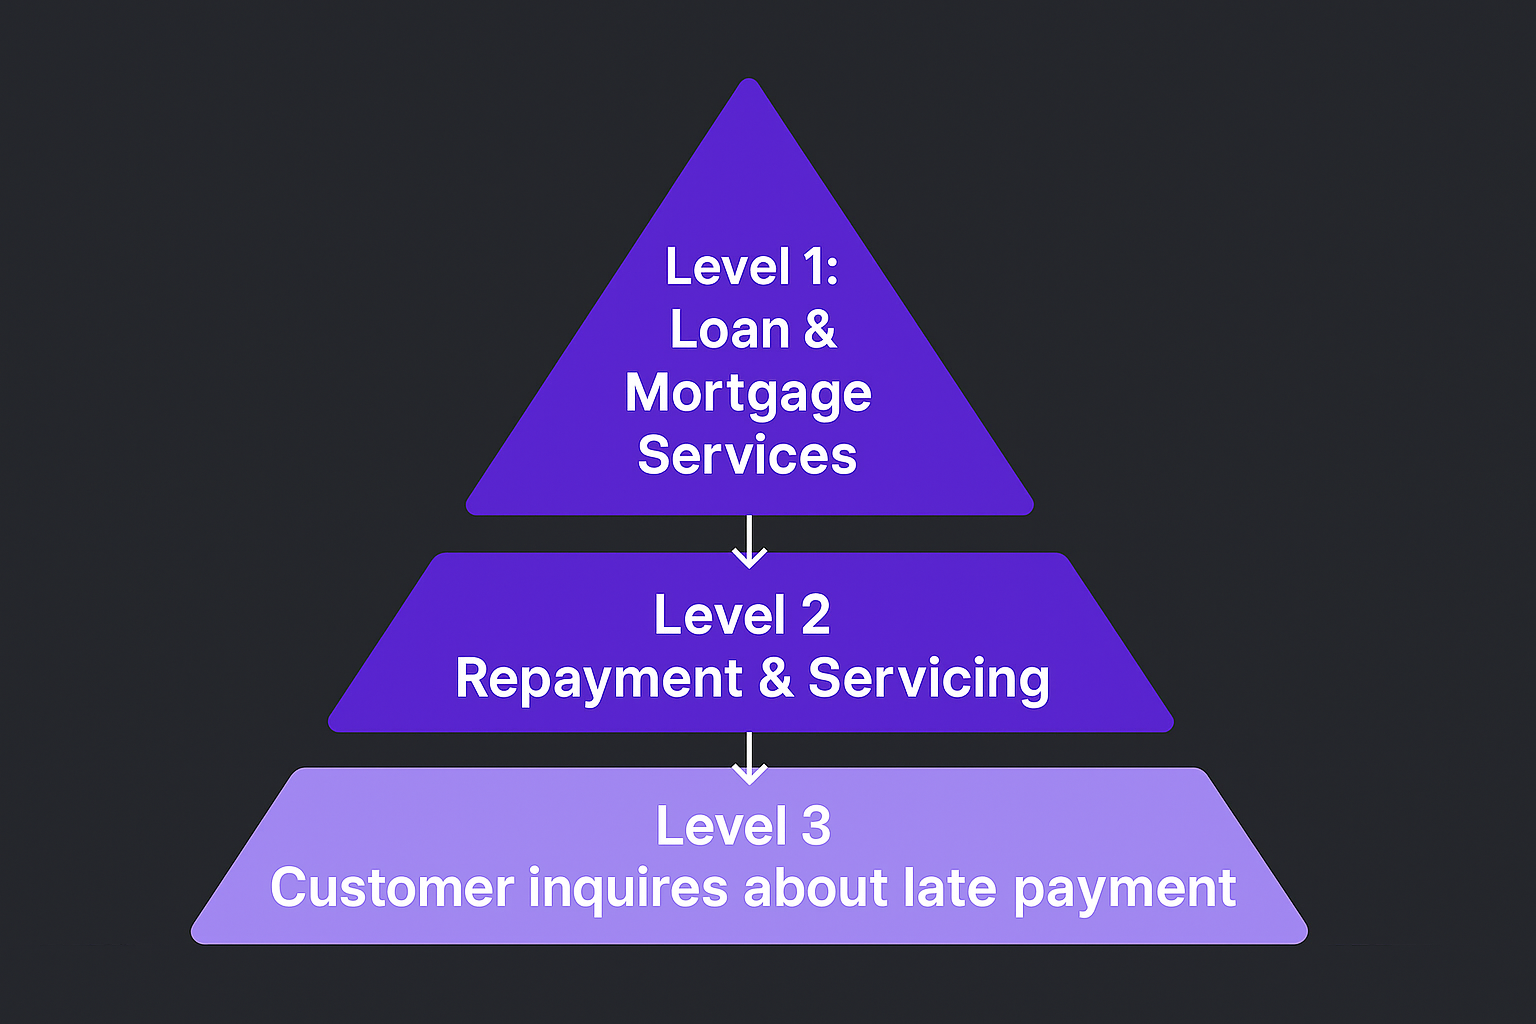
This structure enables a business to move from a high-level view ("How is our Loan & Mortgage Services department performing?") to a specific, actionable insight ("Why is there a spike in customers inquiring about late payments?").
The problem with ‘topic hierarchies’
Generic clustering often struggles to distinguish topic clusters with accuracy. Top-level categories end up too literal or too coarse, and the nuances that distinguish L2 topics get blurred. The result: important drivers and intents are hard to separate cleanly across L1/L2, which limits downstream analytics and actionability.
I. Observe.AI’s Clustering Methodology
Key Tenets
At Observe, we’ve built a robust approach to multi-level clustering that provides accuracy and depth across all interaction drivers, extracted from distilling the intent data from conversations. Observe.AI’s approach focuses on:
- Quality: Distinguish between nuances & variability of interaction drivers in Contact Centers. For instance, for an L1 of “Tour Bookings” there will be established L2s with the right tagging & nomenclature, i.e. a lower chance of finding misplaced L2s such as ‘’Refund Issues” (usually part of Cancellations) or “Rescheduling complaints” (usually part of Tour Modifications)
- Consistency: Reliable granular clustering for not just L1 but L2 and beyond. For instance, if L1 is Financial interactions ’ a “Pending Transaction complaints” & ‘Payment procedure Inquiries” failure would be auto-categorized as different L2s, while generic models are more likely to categorize both interaction drivers under “Payment Issues”
- Flexibility: You can configure and calibrate the number and attributes of generated L1 and L2 categories to enhance output quality, ensuring the methodology is adaptable to your specific requirements. For instance, if “Order Status Inquiries” & “Pending Orders Inquiries” are categorized as two different L1s, you can merge them into a single L1 of “Order Inquiries”
Stage 0: Extracting Intent with Task-Specific LLM Prompts
Before we can group conversations, we first need to understand the core reason for the call. We use Large Language Models (LLMs) with custom prompts to read a conversation transcript and extract a concise intent statement. These prompts guide the LLM to focus on the most important parts of the interaction, like the customer's specific issue or request. This ensures our clusters are based on the why behind the call.
Example:
- Original Transcript Snippet: "Hi, I'm calling because my new ABCPro Air Purifier is making a weird rattling noise. I've tried turning it off and on, but it's still there. Can I get a replacement?"
- Extracted Intent: "Customer requests a replacement for a defective ABCPro Air Purifier.
Stage 1: Building L2 Clusters with Agglomerative Clustering
Once we have intents for all conversations, we begin building our Level-2 (L2) clusters, which are granular, specific topics using agglomerative clustering.then iteratively merges the two closest clusters based on their similarity until we reach the desired number of groups. This process creates tight, highly-related topic clusters.
Example:
- The system starts with individual intents like "request replacement for defective purifier," "my purifier is broken," and "want to exchange noisy fan."
- Because these are semantically similar, the algorithm merges them into a single L2 cluster that we can later identify as "Defective Product Replacement."
Stage 2: Sampling representative L2 cluster topics
To understand what each L2 cluster is about, we need to select a few perfect examples from it, using a method called Maximal Marginal Relevance. MMR helps isolate documents that not only represent the core theme of each L2 cluster but also cover the different aspects within that cluster. MMR is important because it picks examples that are highly relevant to the cluster's main theme but are also distinct, non-repetitive examples of that cluster theme.
Example:
- For the "Defective Product Replacement" L2 cluster, MMR wouldn't just pick three examples that all mention a "rattling noise."
- Instead, it might pick:
- One about a rattling noise.
- One about a product not turning on.
- One about a missing part.
- This gives a complete picture of what "defective product" means in this context.
Stage 3: LLM-Enriched Cluster Representations
This stage is about creating a rich, meaningful identity for each L2 cluster that provides clear interpretability, and establishing a clear name and description for each L2. We generate a "multi-view representation" by combining three different embeddings (or data points):
- The centroid embedding (the mathematical average of all intents in the cluster).
- An LLM-generated name embedding (based on the representative examples).
- An LLM-generated description embedding.
By weighting and combining these views, we create a representation that captures both the raw data and the semantic meaning of the cluster, which is crucial for the final step
Example: For our L2 cluster, the LLM analyzes the representative examples and generates:
- Cluster Name: "Hardware Faults & Replacements"
- Cluster Description: "Customers reporting physical defects or malfunctions with their products and requesting a replacement unit."
Stage 4: Creating L1s with Weighted Agglomerative Clustering
Finally, we create the broad, top-level L1 clusters. Using the rich, multi-view representations of each L2 cluster from the previous stage, we run agglomerative clustering again. This time, the algorithm groups the L2 clusters into broader L1 themes. The weights allow us to control the influence of the data-driven centroid versus the LLM-generated names and descriptions, ensuring the final L1 clusters are logical and interpretable
Example:
- The algorithm looks at various L2 clusters like "Hardware Faults & Replacements," "Shipping Damage Claims," and "Warranty Inquiries."
- It recognizes they are all related to product issues and groups them into a single L1 cluster named "Post-Sale Product Support."
II. Cluster Modeling Workflow
At a high level, we contrast a generic “label-at-once” classification flow with our hierarchical clustering pipeline. Instead of forcing everything through a single classifier, we (a) extract intents, (b) form granular L2 clusters, then (c) compose L1 themes from multi-view representations—yielding categories that align better with how humans organize interaction drivers. This section walks through the training and inference paths behind that pipeline.

Training Phase
Training starts with broad data coverage across all teams, geographies & call lengths, ensuring comprehensive coverage of interactions followed by standard cleaning and prep. We then extract key interaction drivers with an LLM, apply proprietary hierarchical clustering for L1 and L2, and use the LLM again to generate human-readable names and descriptions. A verification layer ensures accuracy before results land in durable stores (a document store plus a vector index) for scale and retrieval.
Inference Phase
The inference phase applies the trained model to new conversations efficiently and at scale. As new interactions occur, the LLM performs interaction driver extraction. The core of this phase is driver inference, where our custom, pre-trained machine learning models assign the appropriate L2 cluster to the new conversation. A final, lightweight post-processing step refines the output by tagging the correct L1 parent theme, ensuring the hierarchy remains intact.
III. Cluster Configuration
We ship an out-of-the-box calibration framework so teams can tune both the number of clusters and the attributes of each cluster. This lets you experiment with granularity and align categories to your business—without being locked into a rigid, one-size-fits-all structure..
- Cluster Quantity configuration
You can set the count of top-level (L1) themes and sub-level (L2) topics to match the level of detail you need. Fewer L1s give a broader view; more L2s reveal finer distinctions within each theme. In short: zoom out for the big picture or zoom in for granularity.
- Cluster Entity Configuration
Beyond counts, teams can refine cluster entities themselves—keeping a human-in-the-loop to improve quality over time. Common operations include:
- Create: Add new L1/L2 clusters (and, where used, deeper levels) with clear parent-child relationships.
- Edit: Update names, descriptions, or topic hierarchies themselves i.e moving an L2 from its parent L1 to another L1, etc, without exposing internal IDs or system specifics.
- Merge: Combine overlapping L2s under the right L1 to reduce redundancy.
- Delete: Retire an L1 and decide how to handle its children (move, merge, or remove).
This calibration step is central to keeping the taxonomy accurate, interpretable, and responsive as new data arrives.
IV. Key Benefits of the Configuration Framework
Our configuration & calibration layer lifts clustering quality in three practical ways:
- Sharper taxonomy. Teams can make timely, context-aware adjustments to default clusters, improving L1/L2 precision, hierarchy accuracy, and the clarity of names/descriptions.
- Faster improvement over time. Human-in-the-loop edits plus a steady stream of new conversations help the model reconfigure quickly and upgrade tags with each iteration.
- Lower cost at scale. We reduce unnecessary LLM calls during cluster generation while maintaining strong performance—driving higher efficiency at lower cost.
V. How our approach compares to standard clustering
Traditional clustering pipelines tend to be rigid, while an LLM-only approach is very expensive. Our hierarchical, LLM-guided method opens up discovery, tightens inference quality, and adds a configurable layer so teams can continuously refine L1/L2 taxonomies without heavy lift. At a glance:
- Broader, intent discovery: Open-ended, exhaustive cluster discovery with very high, human-aligned inference across top- and sub-topics → better capture of interaction drivers.
- Faster, scalable clustering: Move from limited tweaks to rapid, iterative improvement with dynamic cluster entities and unlimited L1/L2 counts.
- Low-effort operations out of the box: Shift day-to-day effort from high/medium to low with default calibration tools and ready-to-ship configuration.
VI. Metrics: How we measure clustering quality
We report two complementary metrics:
- Silhouette Score: This metric measures how well defined the clusters are. A higher score indicates that items within a group are closely related to each other and distinctly different from items in other groups. Essentially, a higher Silhouette Score signifies cleaner topic separation, which means the model is grouping intents more accurately.
- Human Preference Score (HPS): Experts manually rate each cluster's meaningfulness and utility on a scale of 1 to 5. A higher score (e.g., 5 for "perfect sense") validates that the clusters are not just statistically sound, but also practically useful and intuitively clear in real-world application.
Benchmarking: standard agglomerative vs. our multi-view approach

- Baseline (standard agglomerative): Silhouette scores are ~0.035–0.043 across domains, and HPS ranges 3.26–3.48—useful but not consistently aligned with business needs.
- Our approach (multi-view + LLM semantics): Silhouette rises up to 0.071 (Travel domain), and HPS improves by ~36.7% to 4.57–4.72 across domains—clusters that better match human intuition.
These gains show up in both technical cohesion/separation and human judgment, making the taxonomy more actionable.
Benchmarking examples: What changes in practice
We highlight two domains to show how clusters differ qualitatively.
Example A: Travel (Bookings, Changes, Cancellations)
- Standard Clustering: Often produces fuzzy, overlapping groups around specific tours (e.g., “Niagara Falls”), where booking, modification, and cancellation issues are indiscriminately mixed.
- Our Clustering: Clearly separates overarching themes, like "Travel Bookings," and then precisely distinguishes sub-intents such as "Booking/Changes" versus "Cancellations." This clear segmentation simplifies naming, explanation, and subsequent analysis.
Example B: Banking (Loan Applications & Processing)
- Standard Clustering: Typically yields broad "Loan complaints" groups, indiscriminately combining application problems with online workflow issues.
- Our Clustering: Delivers sharper, more actionable groups. For instance, it clearly distinguishes between complaints encountered during the initial application stage versus specific difficulties with online application workflows (e.g., document uploads, status checks, or navigation issues).
Further Reading
Improving Hierarchical Clustering with LLM-guided Multi-view Cluster Representation for Interaction Drivers in Contact Centers
Subscribe to our newsletter.
Frequently Answered Questions

.png)


.png)
.png)