.png)
Top 16 Call Center KPIs w/Benchmarks | The Metrics That Matter
How do you know your contact center is keeping steady on the path toward meeting its goals? It’s all a numbers game. The truth of your call center performance lies in the data. When you’re tracking the right key performance indicators (KPIs), you’ll be able to set smart goals, track your progress, and see improvements as they happen in real-time and in the long-term.
What are call center KPIs?
Call center KPIs are the metrics that show whether your contact center is meeting industry benchmarks for operational efficiency, agent performance, customer experience, and compliance. By leveraging the data your call center is already generating, your leadership team can make informed decisions about staffing, agent training, and overall business goals. This way, you know where you’re meeting the benchmarks, and where there’s still room for improvement.
📈Benefits of tracking contact center performance metrics
Tracking KPIs and comparing them against industry benchmarks — and doing so accurately and efficiently — is a time-consuming process with the potential to create a lot of headaches. Is it really worth it? It really is. Here’s why:
Streamline operations
Time leakage can be a major issue if you don’t know where the problem is. In inefficient call centers, this can add up to revenue lost, unhappy customers, and a ding to your reputation. By tracking your day-to-day operations, you’ll be able to identify leaks and plug them up before they become a flood of lost time. When you measure the most important KPIs, you’ll improve your operational efficiency and increase your service level dramatically.
Increase customer satisfaction
Satisfied customers are the goal of any contact center, but if you aren’t tracking key metrics, you don’t always know what leads to dissatisfaction or a poor customer experience. Call center KPIs will help you better understand customer expectations and where your team is falling short so you can implement changes to better meet their needs. This will lead to a stronger understanding of the customer journey, and increased customer retention and loyalty.
Improve agent performance
Agent productivity is important, but it can’t improve if agents aren’t trained properly or are dissatisfied with business operations. Call center managers can use KPIs to find lapses in agent performance and productivity, and make training decisions that get to the crux of the issue and get it resolved in less time.
Make better strategic decisions
Using data analytics to track KPIs provides you with actionable insights you can use to power better decision-making. You’ll also be able to tell if your decisions are the right ones by watching the metrics for signs of improvement.
Top 15 call center KPIs
This isn’t a comprehensive list of all the KPIs you could be tracking for your contact center, but it is a list of some of the most critical metrics you can use to boost performance and increase efficiency. If you’re just getting started with KPI tracking, this is the list to get you going.
1. Average Handle Time (AHT)
Average duration of the entire transaction, from the time the customer initiates the call to ending the call, including all hold times and transfers. Read more about Average Handle Time in our deep dive.
- Benchmark: Varies from organization to organization.
2. First Response Time (FRT)
The average time it takes between a customer submitting a query and an agent responding. Read in detail about First Response Time here.
- Benchmark: Under 3 minutes for phone.
3. Call Abandonment Rate
Percentage of inbound calls where the customer hangs up before speaking to an agent. Here's a deep dive into call abandonment rate to help you lower the incidence of abandoned calls..
- Benchmark: Less than 2%
4. Average Time in Queue (Average Wait Time)
Also called average speed of answer (ASA), this is the average duration a caller waits to be connected to a live agent.
- Benchmark: Less than 4 seconds.
Find out how Observe.AI shifted this center’s ramp speed into high gear with a 97% increase.
5. Percentage of Calls Blocked (Blockage)
The percentage of callers who are not connected due to lack of agents or network issues.
- Benchmark: Less than 2%

6. First Call Resolution (FCR)
FCR, also called first contact resolution, refers to the percentage of calls with customer issues that are resolved the first time with no follow-up call back required. Read more about First Call Resolution (FCR) in our deep dive.
- Benchmark: Between 70 and 75%.
7. On-Hold Time
The average amount of time that a caller is on hold. Callers are put on hold for a number of cases, including when the agent needs to refer to a knowledge base, talk to their supervisor, or run additional verification.
Organizations will often monitor for Hold Time Violations, when a pre-set benchmark is set and the On-Hold Time is exceeded.
- Benchmark: Less than 2 minutes.
8. Supervisor Escalation Rate
Percentage of calls in which the caller requests to speak to a supervisor for resolution. Escalations are caused by a lack of agent knowledge and/or service/product issues. Read more about Supervisor Escalations in our deep dive.
- Benchmark: Less than 10%.
9. After Call Work (ACW)
Average duration after each call an agent takes to carry out post-call processing, including data entry and updates, scheduling follow-ups, and any other communication requirements.
In some cases, organizations will add ACW to the total Average Handle Time (AHT).
- Benchmark: Varies from organization to organization, depending specifically on the complexity of customer queries (eg. healthcare would have a much higher ACW than consumer good support).
10. Dead Air
Total duration of silence on a call. Dead air is characterized as any period of silence over 10 seconds.
- Benchmark: 10 seconds.
11. Customer Sentiment
This is an AI-determined score gauging how the customer felt on the call, from negative to neutral to positive. The most accurate sentiment analysis is tonality-based sentiment analysis, looking at words used, tone, and volume of the speaker.
- Benchmark: Varies by industry.
12. Customer Satisfaction (CSAT)
An average score of how a customer feels about service or a product. It is often presented through a question at the end of each call asking how satisfied the customer was with the call, on a scale of 1-10, and is usually a part of the quality assurance (QA) process. Our CX expert explains CSAT scores in detail here.
- Benchmark: Varies by industry, but generally above 75% is acceptable.
Find out how Observe.AI rocketed this company’s CSAT by 22%.
13. Net Promoter Score (NPS)
A measure of customer loyalty. It is often presented asking “how likely would you recommend our service/product to a friend or colleague?”
NPS is an important KPI metric that you can learn more about here.
- Benchmark: Varies significantly by industry.
Discover how Observe.AI gave this enterprise company's NPS a 25 point lift!
14. Customer Effort Score (CES)
Usually measured by customer surveys, the CES is a metric that tracks the ease with which a customer can interact with the call center. Often measured on a Likert scale of 1-5.
- Benchmark: Varies by industry CES is on a Likert scale where higher numbers are better.
15. Cost Per Call (CPC)
Measures the average cost of one customer interaction, and can be used to set salaries and manage overhead costs. To find CPC, divide total call center costs by the total number of calls answered for a given time.
- Benchmark: Varies by industry, typically between $2.70-$5.60.
Bonus: Compliance Tracking (#16)
Regulatory compliance is paramount across all industries, most notably financial, insurance, and healthcare. It ensures the protection of customer data, backed by strict legislation to enforce it. As a result, monitoring mandatory compliance dialogues and categorizing voice calls relevant to specific compliance regulations is mission-critical.
Benchmarks for compliance are always 100%. Compliance KPIs include:
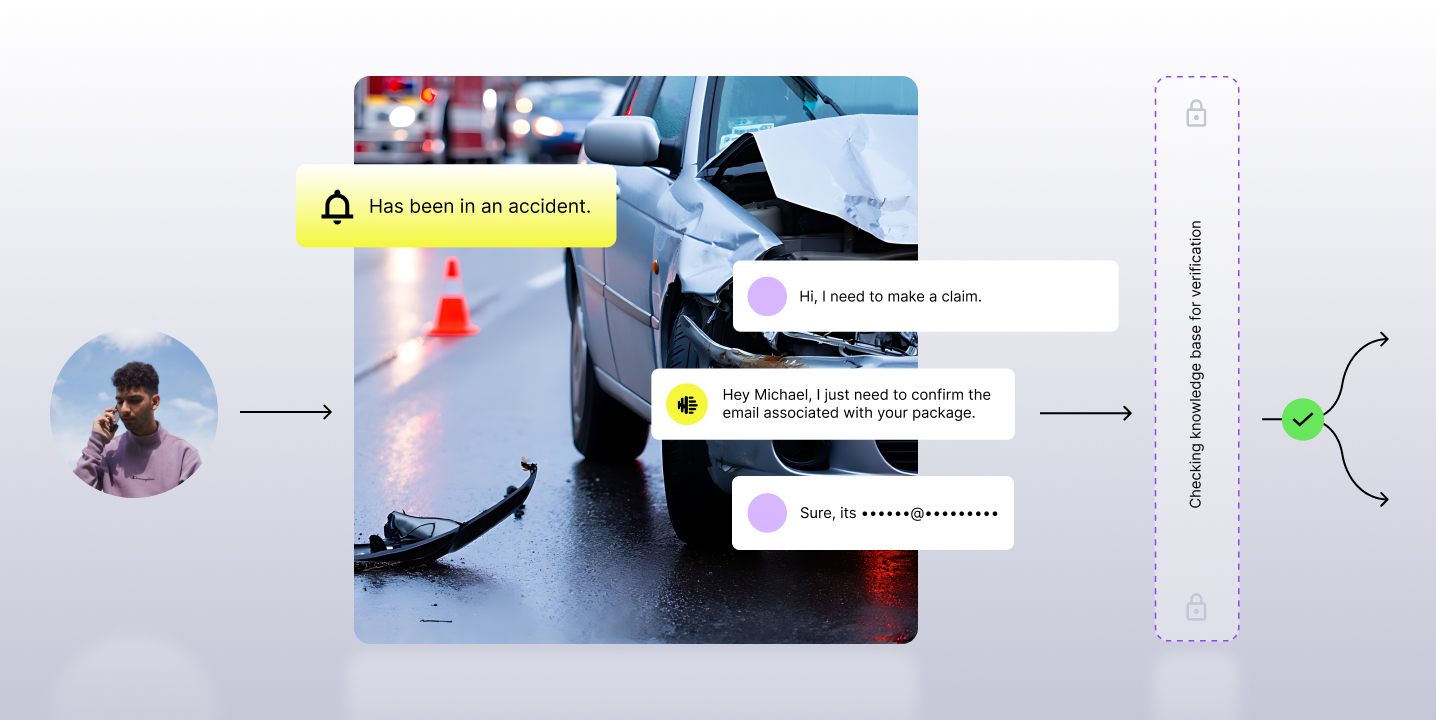
- Customer Verification: Sometimes referred to as Know Your Customer (KYC), customer verification is the act of obtaining and verifying the identity of the caller. Customer verification is used to ensure that services are not misused and privacy isn’t breached.
- Redaction: When recorded calls are captured and stored, Personally Identifiable Information (PII) must be redacted to hide and protect it. Speech Analytics platform and its end users never see that confidential information on call recordings and transcripts. You can read about the different redaction methods in this detailed article.
- PCI Information: Adherence to security regulations to protect a caller’s payment information during a transaction, ensuring safe handling of the information to protect against identify theft or misuse.
In addition to network security, PCI compliance includes customer verification and redaction.
- Recorded Line Message: The act of an agent informing the customer that the call is being recorded.
Want to get started?
Contact center AI software is your answer. Check out our guide on The Future of Quality Management in the Contact Center, where we dive into the most important KPIs in detail, and include best practices, tips on implementation, and choosing the right platforms and technologies.
Subscribe to our newsletter.
Frequently Answered Questions